kafka消息消费延迟
背景
使用的消息中间件是kafka,业务上新增反馈数据,但是测试的时候数据始终没有变化,没有接收到消息。
排查过程
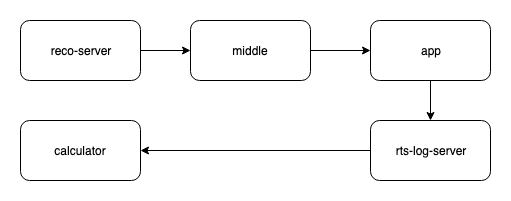
日志的流动过程其实并不复杂,但是很诡异的是就是查不到消息。
推荐下发请求是ok的,抓包看了客户端的上报也是ok的,rts日志那边好像也没有问题,而且我这边好像也能断断续续的收到一些请求。我就怀疑是日志丢了一些,或者中间某一个地方我都日志变了,因为我使用『日志采集计算服务calculate』获取得到的日志中的recoid 和 用户id去查今天的pv日志都没有。后来发现也是没问题的。
然后我从日志采集计算服务中的INFO日志,发现:
[ForkJoinPool.commonPool-worker-57] INFO o.a.k.c.consumer.internals.Fetcher - Fetch offset 11082073049 is out of range for partition vmate_online_merge_log-0, resetting offset
因为是info级别的日志我起初也没有在意,后来排查发现有这个日志说明没有这个偏移量的消息,要么已经消费光了,offset大于当前的了,要么消息被删了。 然后我把采集到的日志信息中的时间戳拿出来,发现是3天前的,因为kafka的落地日志是保留三天,所以如果这个服务消费三天前的,并且在kafka删除了落地日志之后再去消费这个offset的话,那就会报错。
然后从kafka manager里面看到确实是这样:
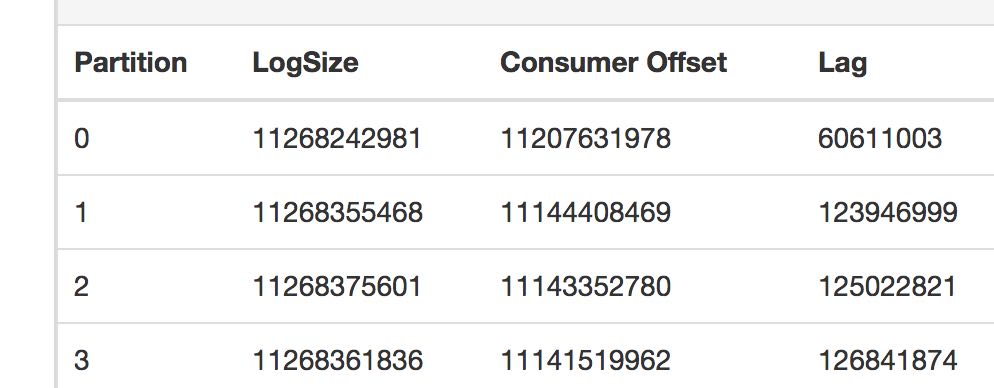
原因是日志采集服务消费得太慢,生产得太快。后面把消费者优化之后消息就逐渐减少了。
后续
我是将kafka的日志消费者从同步改成异步,并且将机器的资源扩容,觉得就能够解决问题了。但是因为消费者的消费速度没有生产者的生产速度快,所以资源被消耗光只是迟早的事情。
首先我发现kafka manager中显示的剩余日志一直再增大,consumer的消费非常缓慢。登录到线上机器也发现业务日志打印的非常缓慢。
这个应用是接入线上kafka消费,然后经过计算之后放入redis cluster中。从redis cluster的监控中也可以看到对redis的QPS在某一个时间节点也是陡降的。
业务GC
查看线程状态:jstack -F [pid] > jstack.log
Thread 40291: (state = BLOCKED)
 - sun.misc.Unsafe.park0(boolean, long) @bci=0 (Compiled frame; information may be imprecise)
 - sun.misc.Unsafe.park(boolean, long) @bci=63, line=1025 (Compiled frame)
 - java.util.concurrent.locks.LockSupport.parkNanos(java.lang.Object, long) @bci=20, line=216 (Compiled frame)
 - java.util.concurrent.SynchronousQueue$TransferStack.awaitFulfill(java.util.concurrent.SynchronousQueue$TransferStack$SNode, boolean, long) @bci=160, line=460 (Compiled frame)
 - java.util.concurrent.SynchronousQueue$TransferStack.transfer(java.lang.Object, boolean, long) @bci=102, line=362 (Compiled frame)
 - java.util.concurrent.SynchronousQueue.poll(long, java.util.concurrent.TimeUnit) @bci=11, line=941 (Compiled frame)
 - java.util.concurrent.ThreadPoolExecutor.getTask() @bci=134, line=1076 (Compiled frame)
 - java.util.concurrent.ThreadPoolExecutor.runWorker(java.util.concurrent.ThreadPoolExecutor$Worker) @bci=26, line=1137 (Compiled frame)
 - java.util.concurrent.ThreadPoolExecutor$Worker.run() @bci=5, line=627 (Interpreted frame)
 - java.lang.Thread.run() @bci=11, line=882 (Interpreted frame)

Thread 605: (state = BLOCKED)
 - io.netty.channel.epoll.Native.epollWait0(int, long, int, int, int, int) @bci=0 (Compiled frame; information may be imprecise)
 - io.netty.channel.epoll.Native.epollWait(io.netty.channel.unix.FileDescriptor, io.netty.channel.epoll.EpollEventArray, io.netty.channel.unix.FileDescriptor, int, int) @bci=19, line=114 (Compiled frame)
 - io.netty.channel.epoll.EpollEventLoop.epollWait(boolean) @bci=68, line=241 (Compiled frame)
 - io.netty.channel.epoll.EpollEventLoop.run() @bci=65, line=258 (Compiled frame)
 - io.netty.util.concurrent.SingleThreadEventExecutor$5.run() @bci=44, line=884 (Interpreted frame)
 - io.netty.util.concurrent.FastThreadLocalRunnable.run() @bci=4, line=30 (Interpreted frame)
 - java.lang.Thread.run() @bci=11, line=882 (Interpreted frame)
发现大量的线程被BLOCK住了。这种情况要么是 线程没有获得运行所需的资源;要么JVM正在进行fullGC。
2019-04-28T00:20:04.413+0800: 186902.474: [GC pause (G1 Evacuation Pause) (young), 0.0025088 secs]
   [Parallel Time: 1.0 ms, GC Workers: 18]
      [GC Worker Start (ms): Min: 186902474.1, Avg: 186902474.1, Max: 186902474.2, Diff: 0.1]
      [Ext Root Scanning (ms): Min: 0.6, Avg: 0.7, Max: 0.7, Diff: 0.1, Sum: 12.3]
      [Update RS (ms): Min: 0.0, Avg: 0.0, Max: 0.0, Diff: 0.0, Sum: 0.0]
         [Processed Buffers: Min: 0, Avg: 0.1, Max: 1, Diff: 1, Sum: 2]
      [Scan RS (ms): Min: 0.0, Avg: 0.0, Max: 0.0, Diff: 0.0, Sum: 0.0]
      [Code Root Scanning (ms): Min: 0.0, Avg: 0.0, Max: 0.0, Diff: 0.0, Sum: 0.0]
      [Object Copy (ms): Min: 0.0, Avg: 0.0, Max: 0.0, Diff: 0.0, Sum: 0.3]
      [Termination (ms): Min: 0.0, Avg: 0.0, Max: 0.0, Diff: 0.0, Sum: 0.6]
         [Termination Attempts: Min: 1, Avg: 1.0, Max: 1, Diff: 0, Sum: 18]
      [GC Worker Other (ms): Min: 0.0, Avg: 0.0, Max: 0.0, Diff: 0.0, Sum: 0.1]
      [GC Worker Total (ms): Min: 0.7, Avg: 0.7, Max: 0.8, Diff: 0.1, Sum: 13.4]
      [GC Worker End (ms): Min: 186902474.9, Avg: 186902474.9, Max: 186902474.9, Diff: 0.0]
   [Code Root Fixup: 0.0 ms]
   [Code Root Purge: 0.0 ms]
   [String Dedup Fixup: 0.4 ms, GC Workers: 18]
      [Queue Fixup (ms): Min: 0.0, Avg: 0.0, Max: 0.0, Diff: 0.0, Sum: 0.0]
      [Table Fixup (ms): Min: 0.1, Avg: 0.2, Max: 0.3, Diff: 0.1, Sum: 3.8]
   [Clear CT: 0.3 ms]
   [Other: 0.8 ms]
      [Choose CSet: 0.0 ms]
      [Ref Proc: 0.3 ms]
      [Ref Enq: 0.0 ms]
      [Redirty Cards: 0.3 ms]
      [Humongous Register: 0.0 ms]
      [Humongous Reclaim: 0.0 ms]
      [Free CSet: 0.0 ms]
   [Eden: 0.0B(920.0M)->0.0B(920.0M) Survivors: 0.0B->0.0B Heap: 17.9G(18.0G)->17.9G(18.0G)]
 [Times: user=0.02 sys=0.00, real=0.00 secs]
2019-04-28T00:20:04.416+0800: 186902.477: [Full GC (Allocation Failure)  17G->17G(18G), 48.9847776 secs]
   [Eden: 0.0B(920.0M)->0.0B(920.0M) Survivors: 0.0B->0.0B Heap: 17.9G(18.0G)->17.3G(18.0G)], [Metaspace: 74131K->74131K(1118208K)]
 [Times: user=72.54 sys=0.39, real=48.98 secs]
Young GC没什么问题,但是程序一直在Full GC,而且GC时间特别长,打到了48秒,而且GC之后的堆大小17.9G(18.0G)->17.3G(18.0G),没有根本解决问题。
ActionCalculator.increase cost:0
CalculatorFactory.increaseUserProfile cost:0
CalculatorFactory.increaseVideoFeature cost:0
CalculatorFactoryHelper.updateVideoFeature cost:46863
CalculatorFactoryHelper.updateVideoFeature cost:93561
CalculatorFactoryHelper.updateVideoFeature cost:46901
CalculatorFactoryHelper.updateVideoFeature cost:46847
CalculatorFactoryHelper.updateVideoFeature cost:46915
ActionCalculator.increase cost:0
CalculatorFactory.increaseUserProfile cost:0
CalculatorFactory.increaseVideoFeature cost:0
CalculatorFactoryHelper.updateVideoFeature cost:93573
CalculatorFactoryHelper.updateVideoFeature cost:46864
CalculatorFactoryHelper.updateVideoFeature cost:46913
看了一下线上的性能日志,发现updateVideoFeature方法特别的耗时。
而我是用CompletableFuture自带的线程池runAsync去执行的,这个线程池是一个无边际的线程池,如果一直提交任务,并且任务的提交速度大于完成速度,那资源迟早会被消耗光。也就是Full GC产生的大致原因。
具体原因
CalculatorFactory.increaseUserProfile cost:1
CalculatorFactoryHelper.updateVideoFeature.getVideoFeature cost:264
CalculatorFactory.increaseVideoFeature cost:0
ActionCalculator.increase cost:1
CalculatorFactory.increaseUserProfile cost:1
CalculatorFactoryHelper.updateVideoFeature.hset cost:40
CalculatorFactoryHelper.updateVideoFeature.getVideoFeature cost:186
CalculatorFactoryHelper.updateVideoFeature.expire cost:40
CalculatorFactoryHelper.updateVideoFeature cost:188
CalculatorFactoryHelper.updateVideoFeature.expire cost:4
CalculatorFactoryHelper.updateVideoFeature cost:559
CalculatorFactory.increaseVideoFeature cost:0
CalculatorFactoryHelper.updateVideoFeature.expire cost:40
打印出具体函数之后发现,redis cluster中的hset,expire这样的时间复杂度是O(1)的API,都非常耗时,然后仔细排查了一下,应该还是大Key操作的导致的问题。这样的大key和一些耗时点redis api太多会导致命令排队,所以hset,expire在程序这边看来也很耗时。
大key具体存储方式是使用redis hashset,一个key中存放了非常多的field,每一个field对应的value是一个json string,这可能导致在hmget 和 hmset的时候比较慢。
目前的优化方式是:
-
获取hmget的地方加一个本地缓存,不用每次都带几千个field去请求redis,但这样会有一个问题是这样取得到的特征就不是经过计算得到的最新的了,所以这边只做了一个30s的写缓存,如果30s没有写之后失效。(没有做AB
-
在hmset的地方做一个本地聚合,因为每一个field对应的value值其实是由redis中其他明细数据计算出来的。所以本地聚合像重启之类的,丢失也没有关系,只有明细数据是更新正确的,那么下一次计算就会用准确度明细数据更新。同样由于有本地聚合,特征会更新延迟一些,目前观测线上日志是每隔5s会做一个计算。时间也能够接受。